Abstract: In the first year, a clear majority of the investigated companies secured more than $0.395m of seed or angel funding; in the second year, a clear majority secured more than $4.366m of Series A or venture funding; and in the third year, a clear majority secured more than $11.131m of Series B funding.

At bitstars GmbH / HoloBuilder Inc. I’ve been a part of “start-up grad school” for almost two years now. Most of the time the early years of a start-up are a constant fight for a good valuation and big investments. The first steps towards a real, innovative product, the hunt for customers who (are going to) pay actual money to use it and pitching nice figures to potential investors are at the core of this process. Recently, I’ve repeatedly asked myself what the early rounds of funding of the most successful start-ups looked like and whether they might all have something in common. So I’ve done some number crunching on the topic.
Method
First off, I needed a list of companies that are commonly recognized as highly successful start-ups. The most prominent features of these are high valuations and huge amounts of raised money. I went with Inc. magazine’s “15 Most Valuable Startups in the World”, the Telegraph’s “most valuable start-ups in the world” and Verge HQ’s “Top 20 Startups of All Time”. The 44 companies found in these three articles (Uber, Airbnb and Dropbox, among others) are referred to as “Group A” in the following. To complement the list with some very successful start-ups that have not (yet) reached the status of the above big players, I’ve created an additional “Group B”. It comprises 16 companies found in “10 Wildly Successful Startups and Lessons to Learn From Them” by Inc. magazine and the top 7 exits in the portfolio of “leading global venture capital seed fund and startup accelerator” 500 Startups.
In the next step I consulted CrunchBase and for every company in my list—as far as the data was available—looked up the money raised in the first three major rounds of funding and in which month/year it happened.1 Using the Consumer Price Index (CPI), all numbers have been inflation-adjusted, i.e., they are the equivalent amount of money that would (have to) be raised in October 2016. There was no data available for 5 companies from Group A, which left me with a total of 55 data sets—39 in Group A (71%) and 16 in Group B (29%).
In the following I report on my findings for groups A and B as well as both groups combined. They particularly focus on how much money was raised in the different rounds of funding and how many months after the founding of a company it happened.2 Before the analysis, outliers were removed from both data series (the amounts of money raised and months after founding) separately using Tukey’s test for outliers based on groups A and B combined.
The raw data I used for my analysis can be publicly accessed at https://docs.google.com/spreadsheets/d/1ge7RaUe6Pc6bpBM6PtbkVlgg35mmTJTMVSx3vbmb2s8/pubhtml.
1 Multiple investments of the same type (e.g., “Series A”) that happened in a relatively short time span were aggregated considering the month/year of the latest investment as the effective date.
2 The date of the first investment was assumed as the founding date of a company if it was earlier than the founding date given by Crunchbase. In case only the founding year of a company was given, I assumed June of that year as the founding date; or January if the first investment already happened in June or earlier.
1st Round of Funding
The seed or first angel investment (in case there was no dedicated seed round) of a start-up was considered as the first major round of funding. For this, Crunchbase provided data on 16 companies from Group A and 8 from Group B.
When looking at Group A—the most valuable start-ups—on average they raised roughly $0.932m (σ ≈ $0.692m) and reached this milestone an average 7 months (σ ≈ 5) after the company was founded. Interestingly, the Group B start-ups on average raised more money in this first round, i.e., $1.374m (σ ≈ $0.976m), which averagely happened 6.5 months after founding (σ ≈ 6.5).
Combining the two groups gives us an average of $1.080m (σ ≈ $0.804m). This money was raised roughly 7 months after founding the start-up (avg. ≈ 6.8, σ ≈ 5.5). Neglecting outlier investments1, 75% of all considered companies raised more than $0.395m and managed to do so within the first 10.5 months after founding. For Group A only, these numbers are $0.395m and 11.25 months.
1 That is, an investment that is an outlier in either the money or the time dimension.
2nd Round of Funding
The Series A or first VC investment (in case there was no dedicated Series A) of a company was considered as the second major round of funding. Crunchbase provided data on 37 companies from Group A and 16 from Group B for this.
Group A secured an average $11.372m (σ ≈ $7.573m) in this round, roughly 16 months after founding (avg. = 16.25, σ ≈ 10.12). Group B falls a little short, with “only” $7.032m raised on average (σ ≈ $5.361m), but in a similar timeframe (avg. = 16.8, σ ≈ 10.73). The average amount raised by Group B is about 62% of that raised by Group A.
Combining the two groups yields an average of roughly $9.925m (σ ≈ $7.160m) raised after approximately 16.5 months (avg. ≈ 16.43, σ ≈ 10.20). Not considering outlier investments, 75% of the start-ups in both groups achieved a Series A/Venture funding of over $4.366m within the first 23.25 months of their existence. When looking at Group A only, these numbers change to $5.471m and 23 months.
3rd Round of Funding
The Series B investment was considered as the third major round of funding. For this, Crunchbase provided data on 31 companies from Group A and 13 from Group B.
Group A companies raised an average investment of roughly $25.619m (σ ≈ $14.093m) in this round, at an average 27.54 months (σ ≈ 12.35) after having been founded. The relative difference to Group B stays almost constant compared to the second round of funding, with an average investment of roughly $15.614m (σ ≈ $14.093m). These are 61% of the funding secured by Group A. Group B companies secured their investments an average 32.92 months (σ ≈ 17.22) after having been founded.
When looking at both groups combined, the average investment is roughly $22.196m (σ ≈ $12.998m), averagely 29.24 months (σ ≈ 14.09) after the founding of the company. 75% of all considered start-ups secured an investment of at least $11.131m within the first 35 months (without outlier investments). For Group A only, these numbers are $13.167m and 33 months.
Conclusions
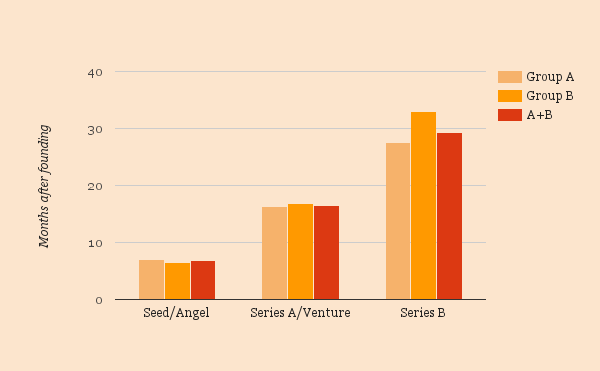
The question posed in the title of this article is “What Do Highly Most Successful Start-ups Have in Common?”. So let’s see what we’ve learned. First off, Seed/Angel funding seems to be usually secured within the first, Series A/Venture funding within the second and Series B funding within the third year of existence.
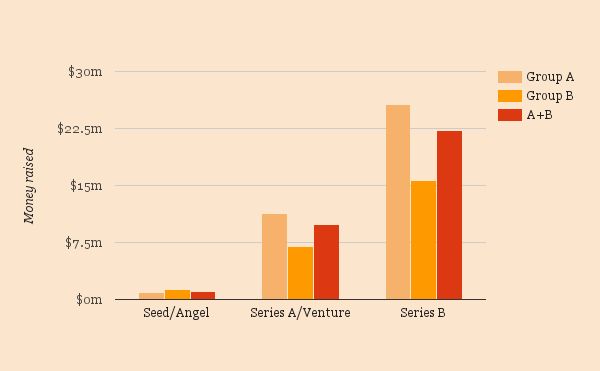
When looking at the amounts of money raised, it becomes evident that the difference between the most successful (Group A) and the slightly less famous (Group B) companies is neglectable in the first round of funding, but becomes more considerable in the following two rounds. This is most probably due to a mutual effect of “If you raise more money you become more famous” and “If you are more famous you can raise more money”. Still, the first huge investment usually comes before the fame. Therefore, the numbers given in this article can be (cautiously) considered a common trait of highly successful start-ups.
Hence, to answer the initial question: Based on the first quartiles determined earlier we can state that in the first year, a clear majority of the investigated companies secured more than $0.395m of seed or angel funding; in the second year, a clear majority secured more than $4.366m of Series A or venture funding; and in the third year, a clear majority secured more than $11.131m of Series B funding.
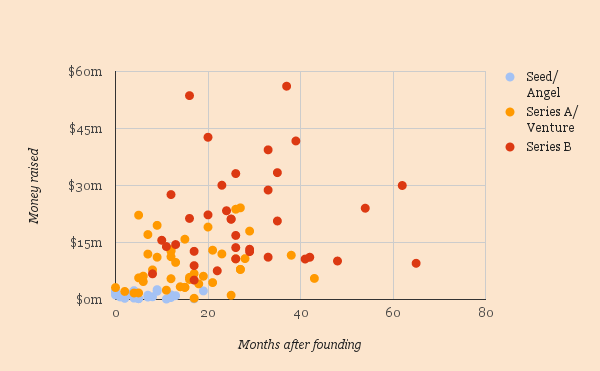
Additionally, the following scatter plot maps all investigated investments (without outliers) from all three rounds. As can be seen, the rounds overlap and the variance in both money and time becomes bigger with each round of funding.
Finally, it is important to note that my analysis—as originally intended—only investigates the commonalities in the funding of the considered companies. What I haven’t done was to look at what explicitly distinguishes these (highly) successful start-ups from start-ups that failed. That being said, although proper funding most of the time is a key factor to success, you can raise just as much money as the companies described above in the same amount of time and still fail if you don’t make proper use of your investments. The other way round, it’s of course also possible to fall short of the figures above and still build a highly successful start-up. Always bear in mind that it takes more than money to transform a start-up idea—no matter how awesome it is—into a successful company!
(This article has also been published on Startups.co.)
